I spent part of last summer building a system that parses Federal Election Commission records and, along with my colleagues Louie Torres and Dmitri Slavinsky, a system that helps our researchers link members of the Forbes 400 to political contribution records.
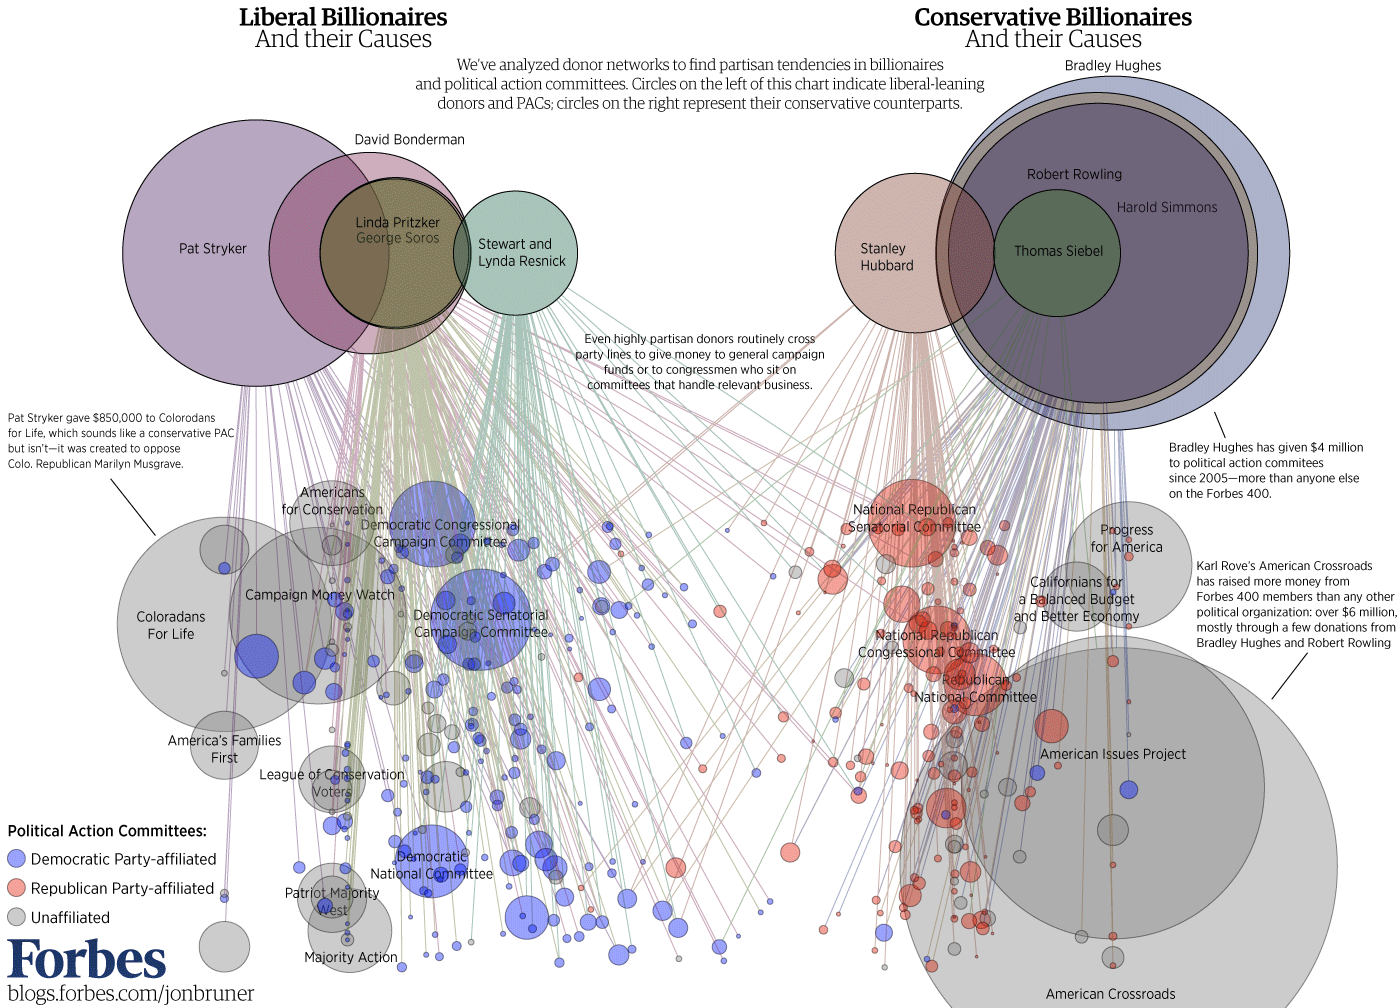
We’ve made that data an important part of our Forbes 400 profiles (scroll down on publisher gnome Sam Zell’s page, for instance, to find a breakdown of his political contributions as well as direct links to original filings). I’ve also visualized it a couple of times: in an interactive graphic last year and in a more focused static graphic this year. The smaller graphic, which shows every contribution by the ten biggest contributors, is more effective at illustrating the point I make in the accompanying article: that many of these contributors are not motivated by ideology but by lobbying power, as evinced by their donations to politicians in both parties (some even contribute to multiple candidates in the same race).
It was fairly easy to assemble the data for these graphics (and for the companion pages in the October 10, 2011 issue of the magazine). The hardest part of writing both graphics–whether in ActionScript for the interactive one or in Python/SVG for the static one–was developing the equation for finding the endpoints of a line drawn between the edges of two circles whose centerpoints and radii are known.
In case it’s useful, here’s the Python function I wrote that will take x and y centerpoints and radius for two circles and return the endpoints of the shortest line that connects their edges. If you’re using Python, be sure to send in your parameters as floats rather than ints; otherwise, you’ll end up with a big jumble of rounded numbers that won’t connect your circles very nicely at all. This is a casewise function, each case being an orientation of the circles relative to each other: circle 1 above and to the left of circle 2; circle 1 above and to the right of circle 2; etc.
import math

#Where x1, y1, r1 are centerpoint x, centerpoint y, and radius of circle 1
#and x2, y2, r2 are centerpoint x, centerpoint y, and radius of circle 2
def getEndpoints(x1, y1, r1, x2, y2, r2):
    #Going through the orientation cases
    if (x1 >= x2) & (y1 <= y2):
        theta1 = math.atan(abs(x1 - x2) / abs(y2 - y1))
        theta2 = (math.pi / 2) - theta1
    elif (x1 < x2) & (y1 <= y2):
        theta1 = -1 * (math.atan(abs(x1 - x2) / abs(y2 - y1)))
        theta2 = (math.pi / 2) - theta1
    elif (x1 >= x2) & (y1 > y2):
        theta1 = math.atan(abs(x1 - x2) / abs(y2 - y1))
        theta2 = -1 * ((math.pi / 2) - theta1)
    elif (x1 < x2) & (y1 > y2):
        theta1 = -1 * (math.atan(abs(x1 - x2) / abs(y2 - y1)))
        theta2 = -1 * ((math.pi / 2) - theta1)

    #The x, y coordinates of one end of the line
    line_x1 = x1 - (r1 * math.sin(theta1))
    line_y1 = (r1 * math.sin(theta2)) + y1

    #The x, y coordinates of the other end of the line
    line_x2 = x2 - (r2 * math.sin(theta1 + math.pi))
    line_y2 = (r2 * math.sin(theta2 + math.pi) + y2)

    return {"x1":line_x1, "y1":line_y1, "x2":line_x2, "y2":line_y2}